The Earning–Owning Gap
What people earn and what people own have been drifting apart for fifty years, and you can see it clearly in the data.
Take two people. Susie earns the median income from work: half of adults earn more than she does, half less. Bob owns the average amount of wealth: all the private wealth in the country, divided equally among adults.
How many years would Susie have to work, saving every penny, to own what Bob owns? The answer, in years of pay, is the wealth-to-pay ratio used throughout this brief. In the United States it was about five years in 1970. In 2024 it was about sixteen.
Download the research brief (PDF, 6 pages) · the findings, charts, literature and references in print form
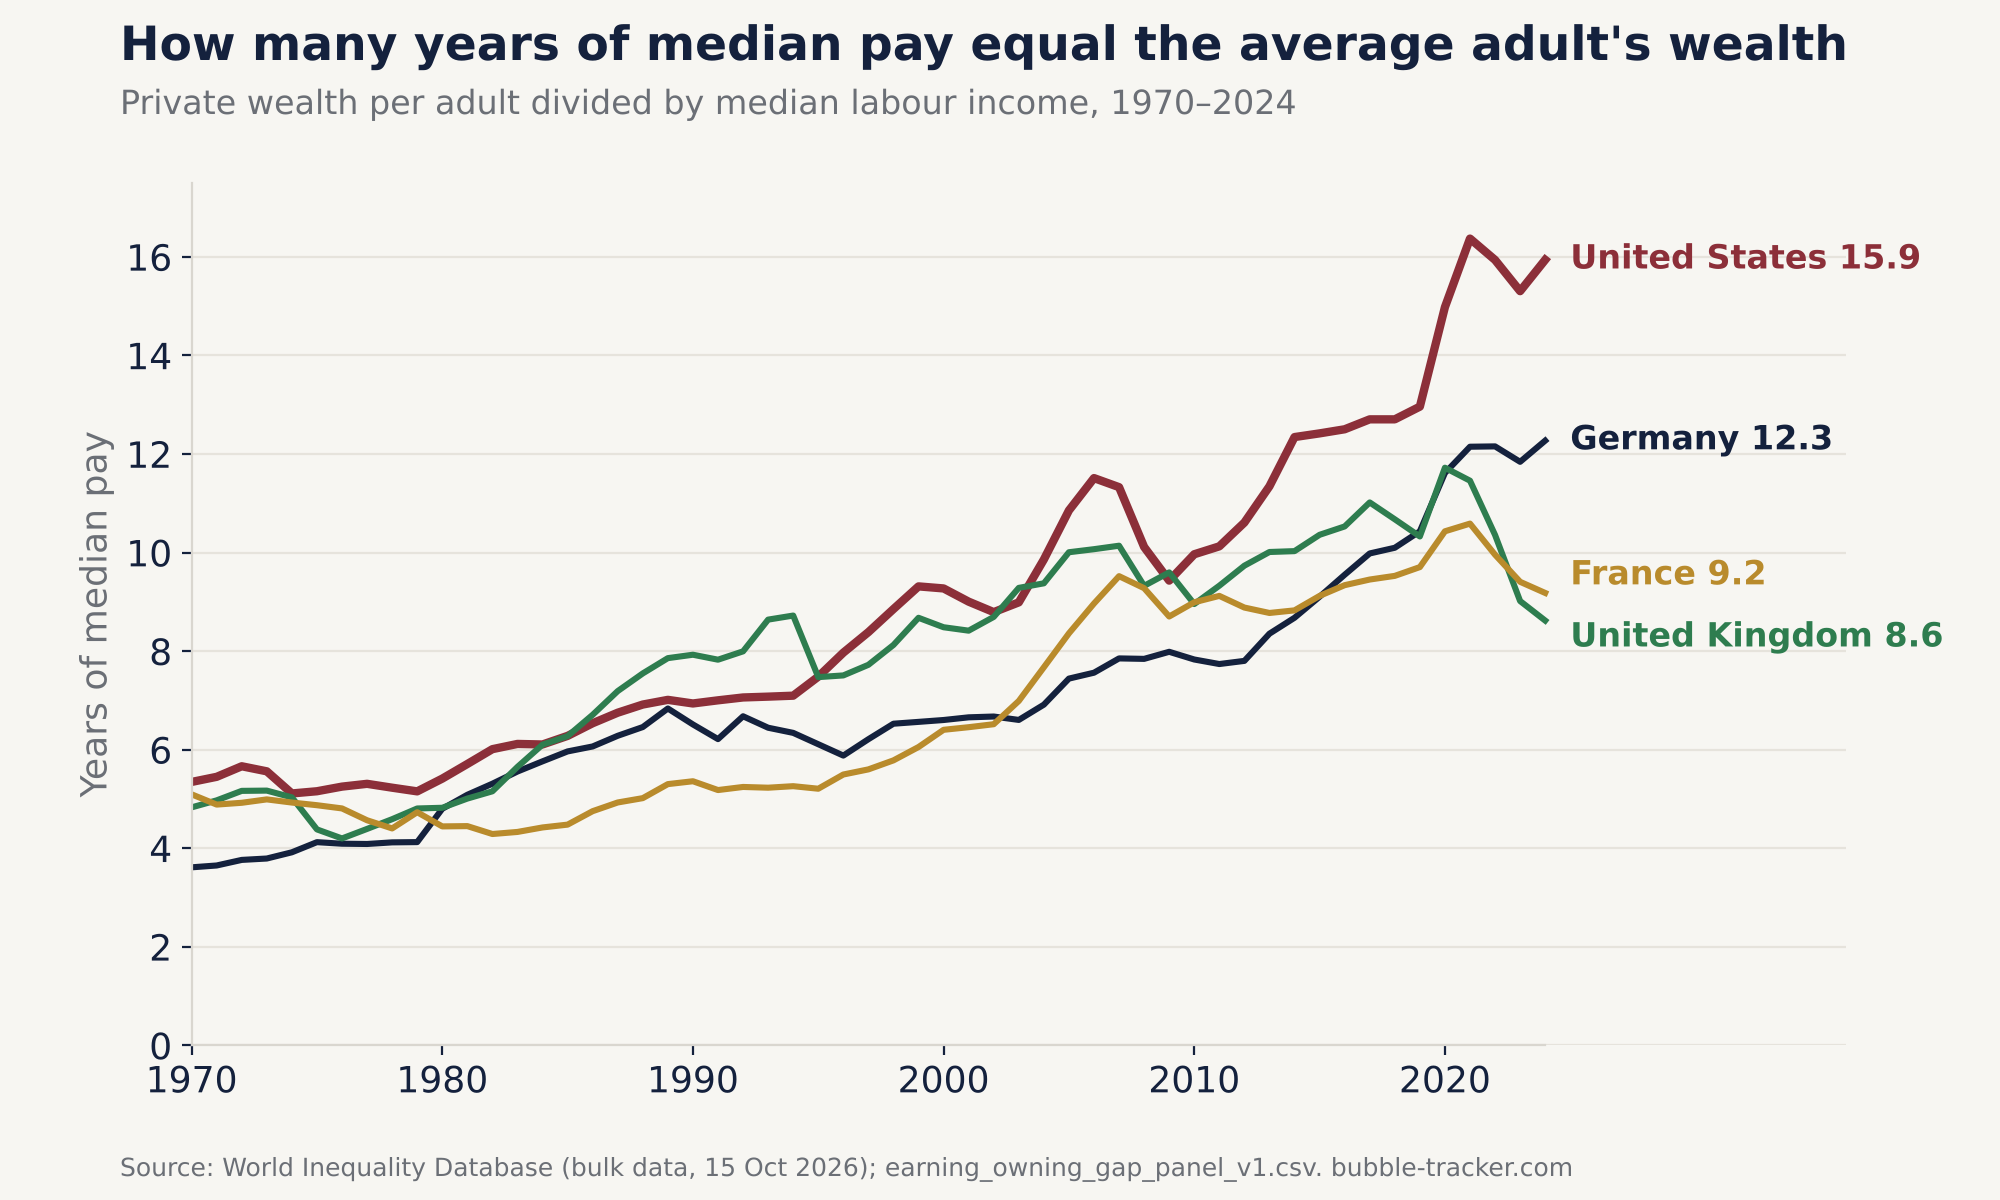
| Country | 1970 | 1990 | 2010 | 2024 | Change |
|---|---|---|---|---|---|
| United States | 5.3 | 6.9 | 10.0 | 15.9 | ×3.0 |
| Germany | 3.6 | 6.5 | 7.8 | 12.3 | ×3.4 |
| United Kingdom | 4.8 | 7.9 | 9.0 | 8.6 | ×1.8 |
| France | 5.1 | 5.4 | 9.0 | 9.2 | ×1.8 |
What published research already shows
Each part of this pattern has been documented in peer-reviewed research: 18 of the 24 works discussed below are articles in refereed journals, 8 of them in the Quarterly Journal of Economics and 3 in the Journal of Political Economy. This brief combines the parts in one measure and splits its change exactly among them.
Private wealth went from about 200–300% of national income in 1970 to 400–600% in 2010 in every country studied.
Rising land prices explain about 80% of the global house-price boom since the Second World War.
Measured consistently and excluding housing, the labour share is stable or rising in the major advanced economies other than the United States and Canada.
US wage inequality above the median kept rising after 1980.
The full literature review covers eight strands, from the labour share to inheritance and politics.
The analysis
Choose a tab for the detail, or go straight to what it means or the economic literature.
What counts as wealth
Bob's wealth is net private wealth as measured in the national accounts: the market value of everything households and non-profit institutions own, minus their debts. That includes homes and the land under them, deposits, bonds, shares, unincorporated businesses, and pension funds and life insurance. It does not include public wealth, the value of people's future earnings, consumer goods such as cars, or pay-as-you-go pension promises like US Social Security or the German and French state pensions, which are paid from current contributions rather than from a fund.
Wealth is valued at market prices, so it rises with house and share prices even when nothing new is built or saved. Its composition differs between countries:
| Country | Housing assets | Pensions and life insurance |
|---|---|---|
| United States | 37% | 29% |
| Germany | 61% | 10% |
| United Kingdom | 56% | 29% |
| France | 59% | 15% |
In Germany, France and Britain housing assets are worth more than half of net private wealth. In the United States housing matters less and funded pensions and other financial assets more, so the US ratio is more exposed to share prices. The low pension shares in Germany and France fit their mainly pay-as-you-go state pension systems, which are not counted as wealth.
Income from work roughly doubled. Wealth grew three to almost six times.
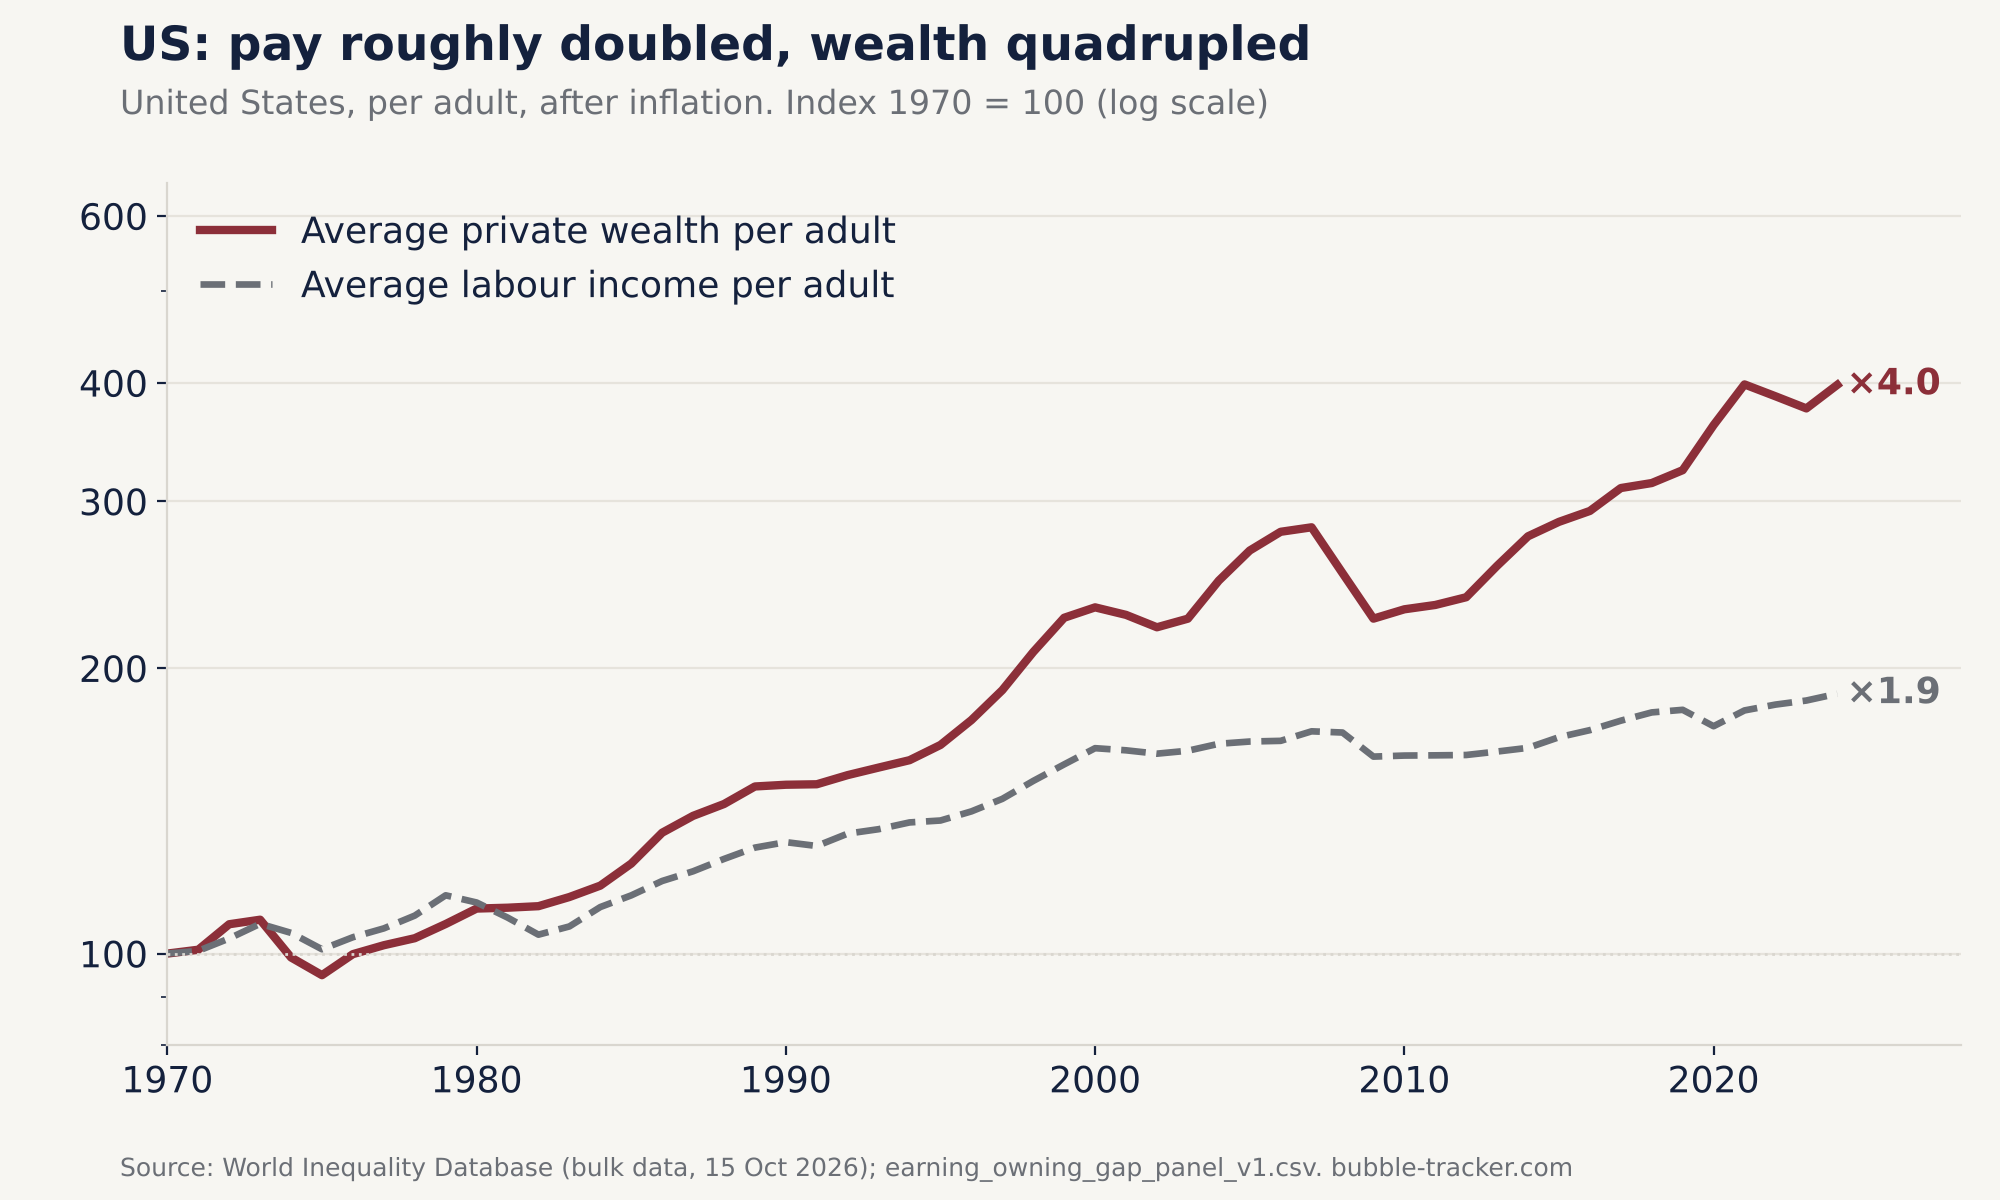
The obvious explanation would be that pay fell. It did not. After inflation, average labour income per adult roughly doubled between 1970 and 2024 in all four countries: ×1.9 in the United States and Germany, ×2.0 in France, ×2.1 in Britain.
Wealth grew far faster: ×4.0 in the United States, ×5.7 in Germany, ×3.2 in Britain and ×3.8 in France, again after inflation.
For the typical American the picture is starker. In Piketty, Saez and Zucman's US distributional accounts, which measure labour income directly, real median labour income per adult did not rise between 1970 and 2010. Depending on the price index, it ended 15% lower (the official consumer price index, CPI-U) or 5% higher (the GDP deflator). Over the same years average labour income rose by between 19% and 47%. Susie at best stood still while Bob's wealth multiplied.
A year of work now buys a much smaller slice of what the country owns.
Most of the rise comes from wealth outgrowing income
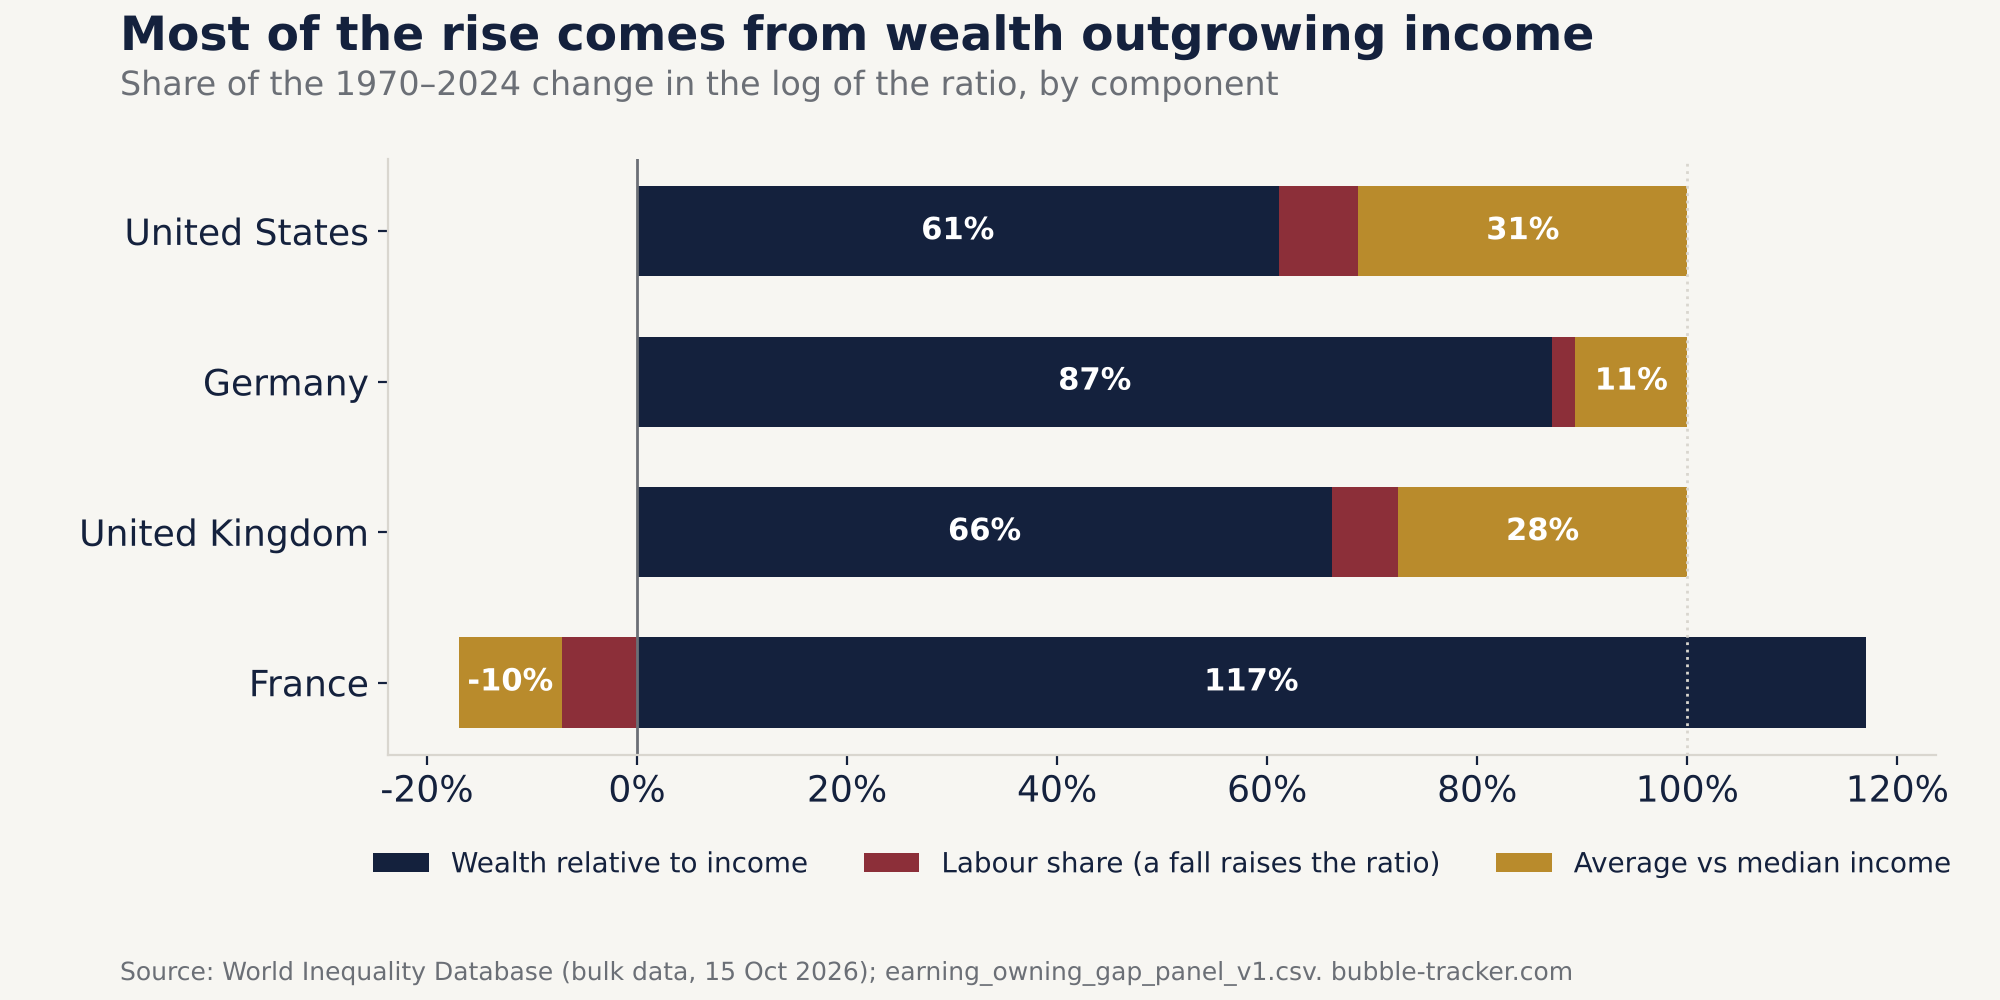
The ratio is the product of three other ratios, so it can only rise for three reasons:
- Wealth relative to national income. It rises when wealth grows faster than the economy.
- National income relative to labour income (the inverse of the labour share). It rises when workers get a smaller slice of income.
- Average relative to median labour income (approximated; see the limits below). It rises when the typical earner falls behind the average one.
In logs, their changes add up exactly to the change in the ratio, so every change can be split among them without a model.
Wealth outgrowing income is the main force everywhere. It explains 61% of the rise in the United States, 87% in Germany, 66% in Britain and all of it in France, where the other two components slightly lowered it.
The labour share explains little. In the United States it fell from 77% to 71% of national income at factor cost between 1970 and 2024, which accounts for 8% of the rise. Its biggest push came in the 2000s, when it added about as much to a small US increase as the widening income spread did, while wealth relative to income fell. Elsewhere its contribution over the whole period is about 6% or less. The often-quoted, steeper fall in the US nonfarm business labour share is a gross measure for the business sector only; on a net, whole-economy basis the fall is smaller.
The spread of incomes matters in two countries. Median income falling behind average income explains 31% of the US rise and 28% of Britain's, mostly in the 1980s and 1990s. In Germany it explains 11%, and in France it worked the other way.
The rise was concentrated in a few decades
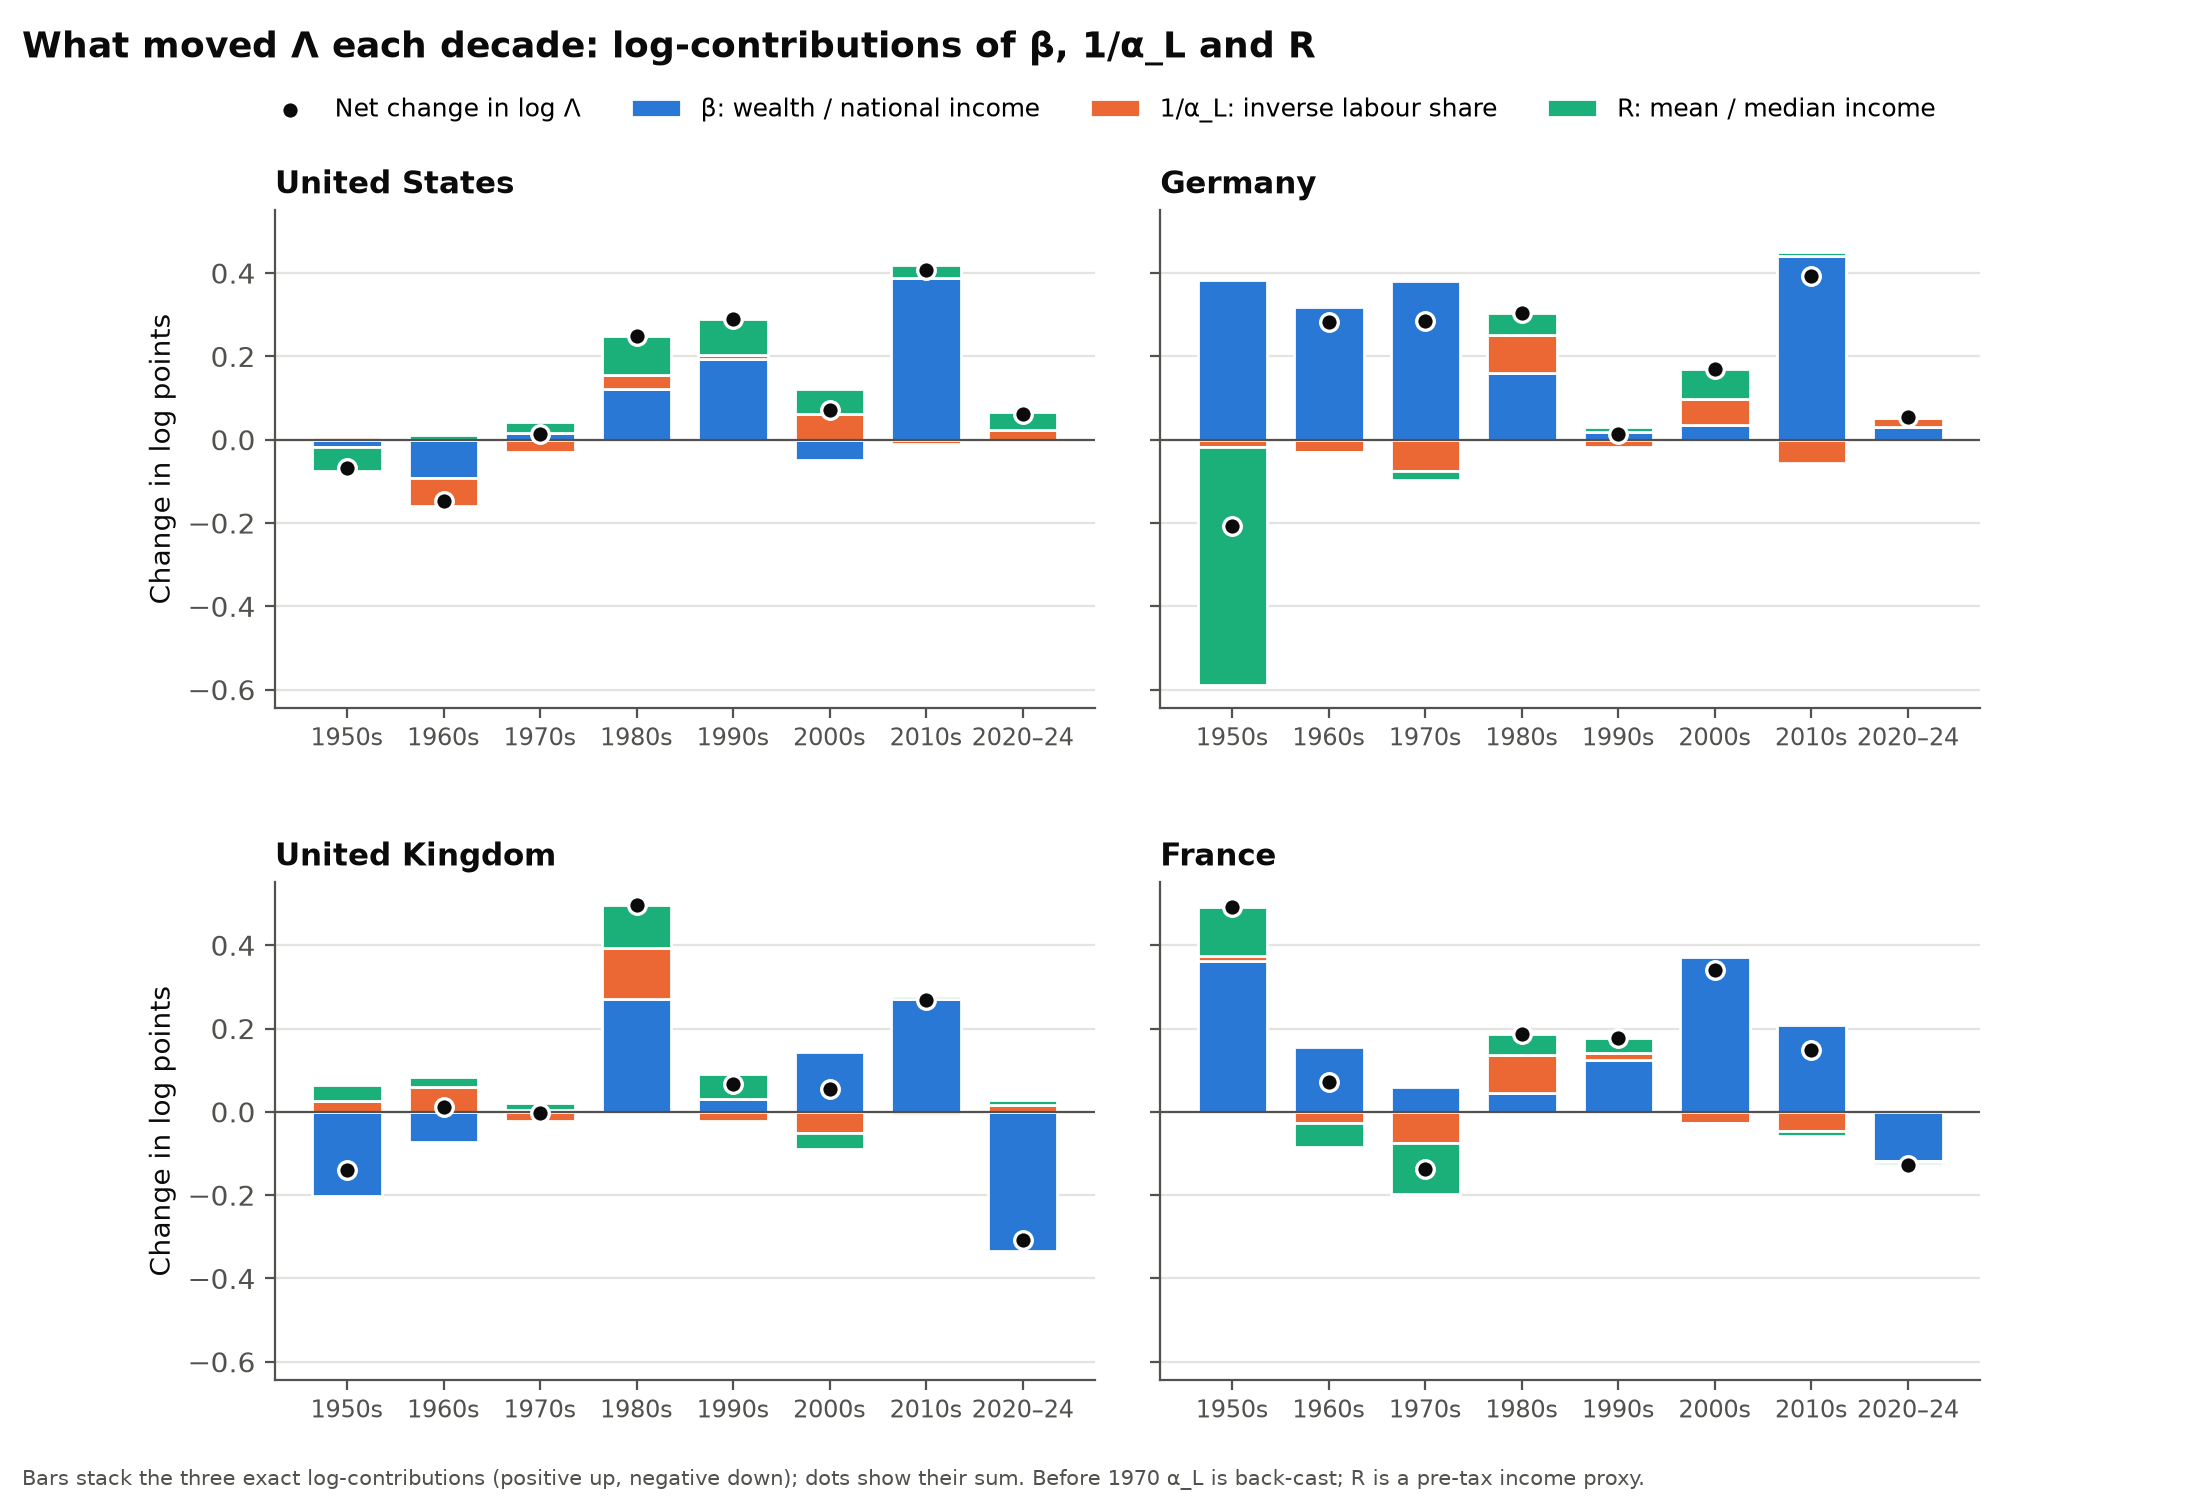
In Britain the biggest decade was the 1980s. In the United States and Germany it was the 2010s, but that decade ends with the 2020 jump, when national income fell in the pandemic. Measured to 2019, the US rise of the 1990s and the German rise of the 1980s were slightly larger.
From 2010 to 2019, wealth outgrowing income accounts for 89% of the rise in the United States, 113% in Germany, 86% in Britain and 116% in France. Inequality added a little in the United States (14%), little in Germany and Britain (4% and 5%), and in France it lowered the ratio. The labour share held steady or rose, except in Britain, where its fall added 9%.
Britain shows that a rise built on prices can reverse
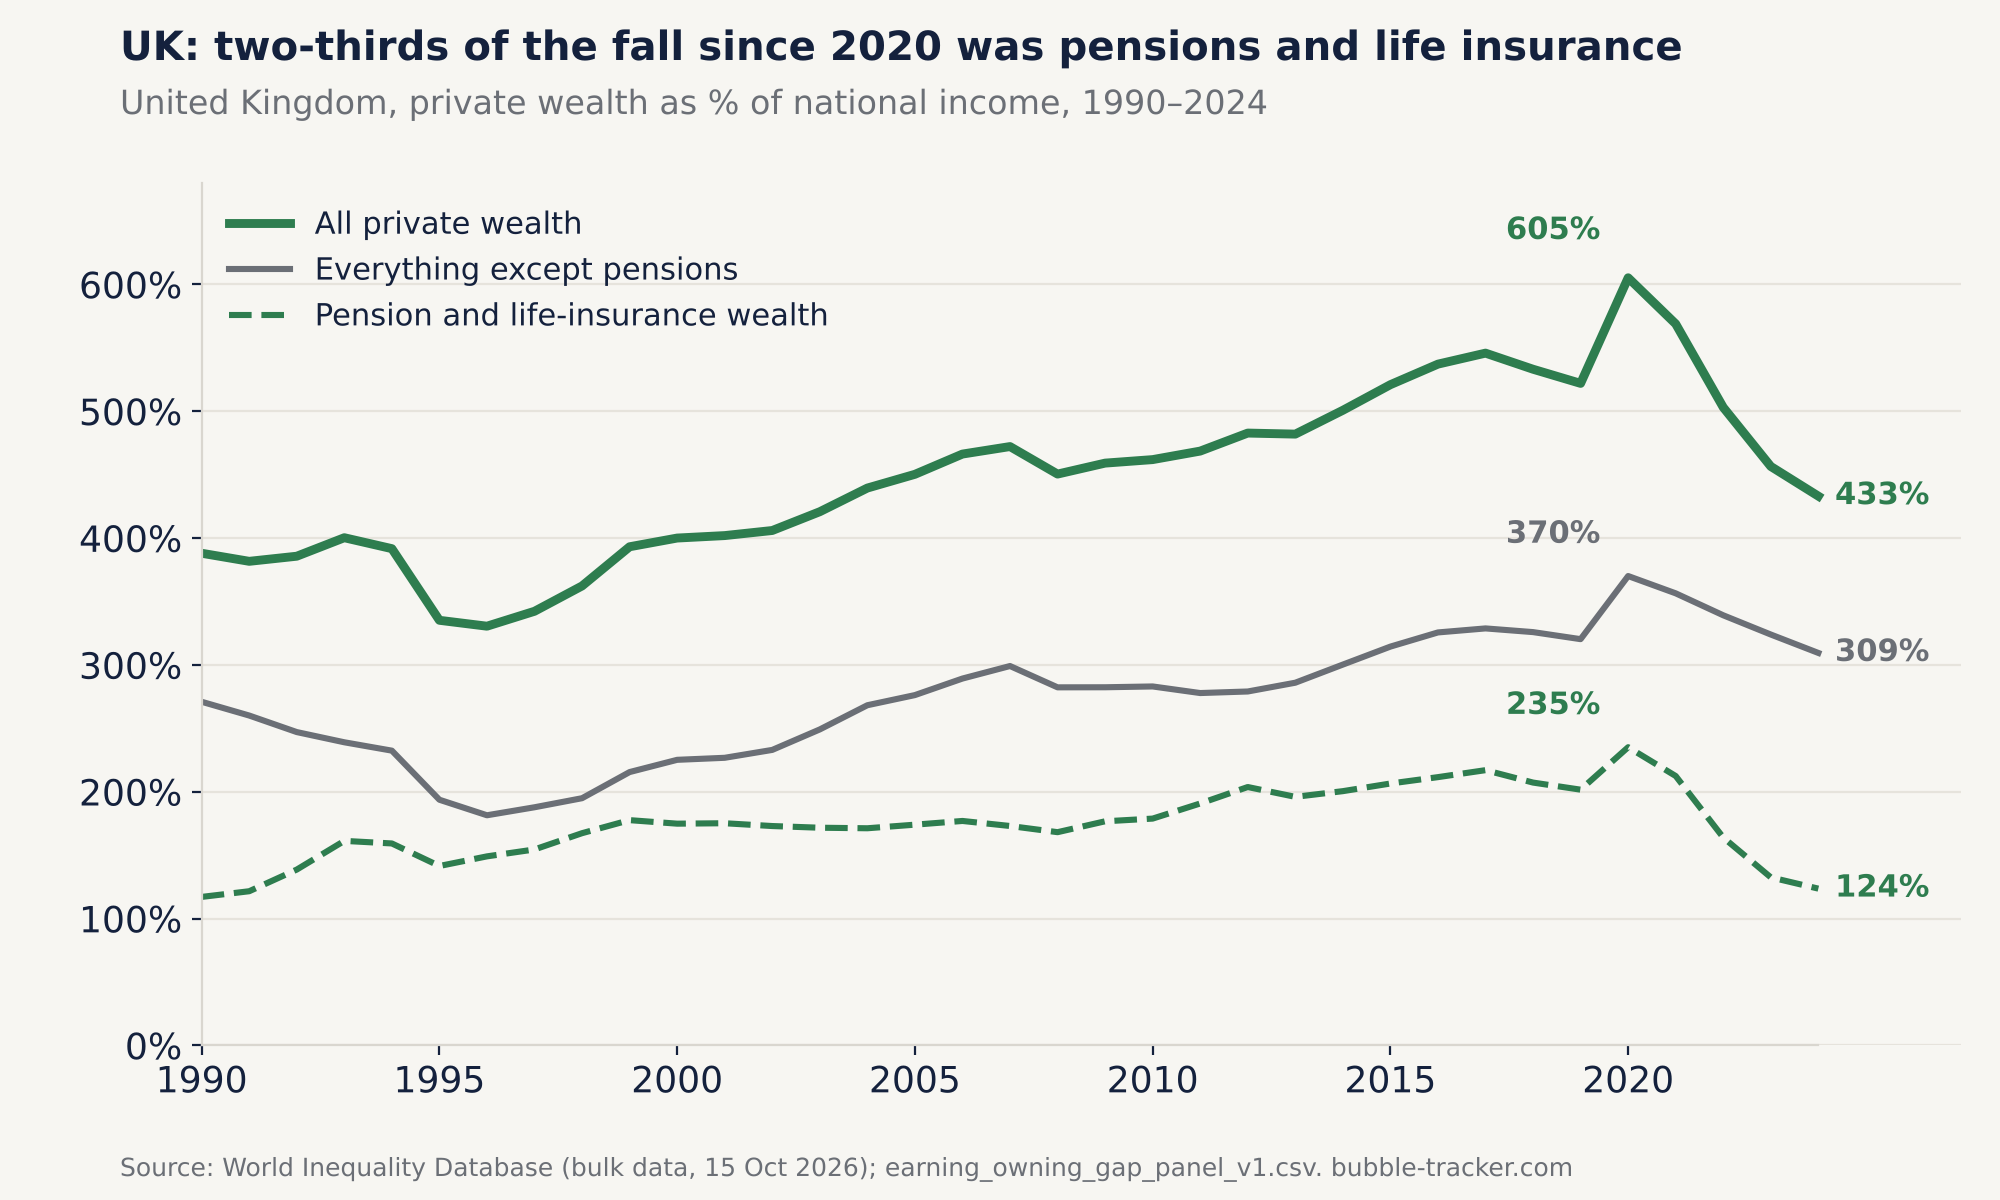
The decomposition shows that wealth outgrew income. It does not show how. Wealth can grow faster than income in two ways: people save more of their income, or the things they already own go up in price. Britain and Germany show the difference.
Britain repriced its way there, and partly back. In Piketty and Zucman's balance sheets (2014, online appendix Table A104), capital gains explain between 79% and 97% of the 1970–2010 rise in Britain's private wealth-to-income ratio, depending on the method. Britain's ratio peaked at 11.7 years in 2020, partly because national income per adult fell 13% in the pandemic. Private wealth peaked the same year at 605% of national income and fell to 433% by 2024, about two-thirds of it through pension and life-insurance wealth, which fell from 235% to 124%. By 2024 Britain was the only one of the four countries whose ratio was back below its 2010 level (France's was only just above it). Leave pensions out, and its ratio still rose between 2010 and 2024.
Germany saved its way there, at least until 2010. The same Piketty–Zucman accounts show German private wealth rising by less than cumulated saving would imply: saving (including other changes in volume) explains more than all of the 1970–2010 rise, and capital gains subtracted from it. Their accounts end in 2010, so they do not cover Germany's steep rise since then.
Wealth is measured at market value, so a rise built on higher valuations can reverse when they fall, as Britain's did after 2020.
What it means
- Pay measures act on the smaller part of the rise. Measures that act on pay, the labour share or the spread of incomes act on the components that together explained about two-fifths of the US rise and an eighth of the German one. They may be justified for other reasons, but in the past they were not the main driver.
- The main driver is the value of existing wealth relative to income. Some policies can act on the ratio itself, by slowing the growth of asset values relative to income; housing policy that lowers house prices relative to incomes is one example, although more supply also adds to the housing stock, so the net effect on wealth depends on how strongly prices respond. Others leave the average unchanged but change who owns it: help for first-time buyers, automatic enrolment in funded pensions, employee share ownership. The ratio measures the distance to the average; these policies decide how many people get across it.
- The tax base may shift. Where labour income is taxed more heavily than returns on wealth, a rising wealth-to-income ratio can shift the burden towards people who work for a living; much of the rise is unrealised gains, which are taxed lightly or not at all until sold or inherited. The relative treatment of labour income, capital income and inheritance deserves a review, whatever direction one prefers.
- Inheritance is likely to matter more. When average wealth is worth sixteen years of median pay, as it is in the United States, saving from earnings is a slow route to ownership, and transfers between generations become the faster one. This brief does not measure inheritance; the implication, to be tested, is that ownership is increasingly likely to come from inheritance rather than from earnings.
If that happens, the link between effort and financial security weakens. My expectation is that this will show up in politics long before it shows up in research.
The economic literature
There are three main strands of literature, one for each part of the ratio, three areas where two of them overlap, and two neighbouring fields. Most of the evidence comes from peer-reviewed journals; Figure 7 marks which works are journal articles and which are books, working papers or conference volumes.
- Wealth relative to income. Piketty and Zucman (2014) showed that private wealth rose from about 200–300% of national income in 1970 to 400–600% in 2010 across rich countries, through saving under slower growth and a long recovery of asset prices (see also Piketty, 2014). On prices, Knoll, Schularick and Steger (2017) find that rising land prices explain about 80% of the global house-price boom since the Second World War, and Jordà et al. (2019) find that housing and equities have earned similar long-run real returns, with housing less volatile.
- The labour share. Karabarbounis and Neiman (2014) documented a global fall since the early 1980s, about half of it linked to cheaper investment goods; Autor et al. (2020) trace the US fall to sales shifting towards “superstar” firms with low labour shares. Gutiérrez and Piton (2020) find that once housing and self-employment are treated consistently, the labour share outside housing is stable or rising in the major advanced economies other than the United States and Canada. This is consistent with the small labour-share contribution found here.
- The spread of pay. Autor, Katz and Kearney (2008) show US wage inequality above the median kept rising after 1980; Goldin and Katz (2008) explain much of the long-run pattern by a race between the supply of skills and technological demand for them.
- (1) Factor shares and asset values. Rognlie (2015) finds that the long-run rise in the US net capital share comes from housing. Greenwald, Lettau and Ludvigson (2025) attribute the largest single part, about 40%, of the 1989–2017 rise in US equity values to a reallocation of income from workers to shareholders.
- (2) Who owns the wealth. Distributional national accounts split national wealth and income across the population (Saez and Zucman, 2016; Piketty, Saez and Zucman, 2018). Smith, Zidar and Zwick (2023) estimate lower top-wealth levels but still find the top 1% share rising from 27% to 34% between 1989 and 2016. Kuhn, Schularick and Steins (2020) show that the American middle class holds its wealth mostly in housing, so house-price booms tend to compress wealth inequality and stock booms to widen it.
- (3) Pay and productivity. Stansbury and Summers (2017) find that typical pay has grown far less than productivity since the 1970s but still moves with it.
- Inheritance and mobility. Piketty (2011) finds the inheritance flow in France U-shaped over two centuries, and Alvaredo, Garbinti and Piketty (2017) put inherited wealth at 50–60% of private wealth in Europe around 2010, up from 30–40% in 1950–80. The micro evidence is mixed: in Sweden, inheritances reduce wealth inequality at first but raise it within about a decade (Nekoei and Seim, 2023); in Norway they are a small part of lifetime resources except for the heirs of very wealthy parents (Black et al., 2025). Fagereng et al. (2025) show that rising asset prices redistribute from buyers, often young, to sellers, often old.
- Political economy. House prices shape attitudes to redistribution and voting (Ansell, 2019); Adler and Ansell (2020) link the geography of house prices to populist votes, including Brexit. Piketty (2020) studies how unequal ownership is justified politically.
Private wealth rose from about 200–300% of national income in 1970 to 400–600% in 2010 across rich countries, through saving under slower growth and a long recovery of asset prices.
Piketty, T. and Zucman, G. (2014). Capital is Back: Wealth-Income Ratios in Rich Countries 1700–2010. Quarterly Journal of Economics 129(3), 1255–1310. Read the paper
What the data cannot say
- Why wealth outgrew income. Interest rates, housing supply, demographics, saving behaviour and capital inflows are all candidates. Blaming monetary policy is a hypothesis, not a finding of this brief.
- Who holds the wealth. The ratio compares the average with the median. It says nothing about how wealth is spread within a country.
- Exact levels. Among these four countries, the World Inequality Database bulk data contain a labour-income distribution only for France (1970–2014). For all four countries the median is approximated from the distribution of total pre-tax income, which includes capital income. This raises the level of the ratio: by 3% to 14% in the United States between 1970 and 2014, compared with the actual median labour income in Piketty, Saez and Zucman, and, in the latest year available, by between 4% (France, 2023) and 30% (United States, 2024; 35% in 2022) compared with the earnings of full-time workers. It changes the trend much less. Measured against full-time earnings, the US ratio still rises from 4.4 years in 1974 to 12.3 in 2024, almost ×2.8. In some years (for example 2024 for the United States and France, 2020 for Britain) the World Inequality Database extends the previous year's income distribution, so the mean-to-median ratio is unchanged from the year before; every such row is flagged in the panel.
- Imputed years. The labour share before 1970 is reconstructed (for Germany from the corporate labour share), and German income-distribution data before 1980 exist only every one to four years. Germany's 1970 value is also an imputation: the raw WID income ratio for that year is an outlier and is replaced by interpolation. Measured from 1971 instead, Germany's ratio still rises ×3.4, 86% of it from wealth outgrowing income.
Data, code and how to check every number
Everything in this brief can be checked. The data are released as version 1.0.2 (17 October 2026) under CC BY 4.0; the code is under the MIT licence. The interactive charts read the same panel file you can download here.
- Research brief (PDF, 6 pages): the findings, literature and references in print form
- Main panel, 1950–2024 (CSV): one row per country and year with the ratio, its three components, levels in constant prices (deflated with WID's national income price index) and every imputation flagged.
- Every number in this brief and how it is computed (CSV)
- Decade contributions (CSV)
- Robustness variants (CSV) and tests (CSV)
- Anchor checks (CSV): the WID wealth-to-income ratios used here are within 21 percentage points of Piketty and Zucman's (2014, Table A5) for the US and Germany in 1970 and 2010.
- Full-time earnings, mean and median (CSV)
- US check against the actual median, 1962–2014 (CSV)
- Codebook, licence, citation file and checksums
- Code (ZIP): downloads the sources and rebuilds the panel, decade, robustness, anchor and earnings files; the US Piketty–Saez–Zucman check and the numbers file come from the two scripts included in its checks folder
How to cite. The brief: Koziol, T. (2026). The Earning–Owning Gap: Wealth vs Pay, 1970–2024 [Research brief]. Bubble Tracker. https://bubble-tracker.com/research/earning-owning-gap. The data: Koziol, T. (2026). The Earning–Owning Gap dataset (Version 1.0.2) [Data set]. Bubble Tracker. https://bubble-tracker.com/research/earning-owning-gap. Please also cite the World Inequality Database (WID), https://wid.world.
Sources and method
Data. Wealth, national income, the labour share and the income distribution come from the World Inequality Database, bulk download dated 15 October 2026 (series wpweali999, wlsnnii999, aptincj992, tptincj992, anninci992 and wpwpeni999). Values in constant prices are deflated with WID's national income price index, which is based on the GDP deflator. The US nonfarm business labour share is from the Bureau of Labor Statistics via FRED (PRS85006173). Full-time earnings come from the US Census Bureau (CPS ASEC historical income table P-43, full-time, year-round workers), the ONS (NES and ASHE), INSEE and Eurostat's Structure of Earnings Survey. The build code also reads the Jordà–Schularick–Taylor Macrohistory Database (release 6) for exploratory house-price and credit series; none of them enters the published files or this brief, and they are not redistributed. The saving and capital-gains split for 1970–2010 is online appendix Table A104 of Piketty and Zucman (2014), and the wealth-to-income anchors are their Table A5. The US median check uses Piketty, Saez and Zucman (2018), deflated with the official consumer price index (CPI-U, Bureau of Labor Statistics) or the US GDP deflator in Piketty and Zucman's Table A148.
Method. The ratio equals private wealth per adult divided by median labour income. It decomposes exactly into the wealth-to-income ratio, times the inverse labour share, times the ratio of mean to median income. Shares of a change are each component's log change divided by the log change of the ratio. All panel series are annual, 1950–2024; per-adult levels refer to adults aged 20 and over, with income split equally within couples. The labour share is WID's share of national income at factor cost, and average labour income is that share times national income per adult. “Britain” in the text means the United Kingdom, which is what the WID data cover.
Contact
Questions about the data, the method or the research? Write to Tina Koziol.
tinak.contact at gmail.com
Opens a pre-filled email in your own mail app.
References
Journal articles
- Adler, D. and Ansell, B. (2020). Housing and Populism. West European Politics 43(2), 344–365. doi:10.1080/01402382.2019.1615322
- Alvaredo, F., Garbinti, B. and Piketty, T. (2017). On the Share of Inheritance in Aggregate Wealth: Europe and the USA, 1900–2010. Economica 84(334), 239–260. doi:10.1111/ecca.12233
- Ansell, B. (2019). The Politics of Housing. Annual Review of Political Science 22, 165–185. doi:10.1146/annurev-polisci-050317-071146
- Autor, D., Dorn, D., Katz, L. F., Patterson, C. and Van Reenen, J. (2020). The Fall of the Labor Share and the Rise of Superstar Firms. Quarterly Journal of Economics 135(2), 645–709. doi:10.1093/qje/qjaa004
- Autor, D. H., Katz, L. F. and Kearney, M. S. (2008). Trends in U.S. Wage Inequality: Revising the Revisionists. Review of Economics and Statistics 90(2), 300–323. doi:10.1162/rest.90.2.300
- Black, S. E., Devereux, P. J., Landaud, F. and Salvanes, K. G. (2025). The (Un)Importance of Inheritance. Journal of the European Economic Association 23(3), 1060–1094. doi:10.1093/jeea/jvae056
- Fagereng, A., Gomez, M., Gouin-Bonenfant, É., Holm, M., Moll, B. and Natvik, G. (2025). Asset-Price Redistribution. Journal of Political Economy 133(11), 3494–3549. doi:10.1086/736769
- Greenwald, D. L., Lettau, M. and Ludvigson, S. C. (2025). How the Wealth Was Won: Factor Shares as Market Fundamentals. Journal of Political Economy 133(4), 1083–1132. doi:10.1086/734089
- Gutiérrez, G. and Piton, S. (2020). Revisiting the Global Decline of the (Non-housing) Labor Share. American Economic Review: Insights 2(3), 321–338. doi:10.1257/aeri.20190285
- Jordà, Ò., Knoll, K., Kuvshinov, D., Schularick, M. and Taylor, A. M. (2019). The Rate of Return on Everything, 1870–2015. Quarterly Journal of Economics 134(3), 1225–1298. doi:10.1093/qje/qjz012
- Karabarbounis, L. and Neiman, B. (2014). The Global Decline of the Labor Share. Quarterly Journal of Economics 129(1), 61–103. doi:10.1093/qje/qjt032
- Knoll, K., Schularick, M. and Steger, T. (2017). No Price Like Home: Global House Prices, 1870–2012. American Economic Review 107(2), 331–353. doi:10.1257/aer.20150501
- Kuhn, M., Schularick, M. and Steins, U. I. (2020). Income and Wealth Inequality in America, 1949–2016. Journal of Political Economy 128(9), 3469–3519. doi:10.1086/708815
- Nekoei, A. and Seim, D. (2023). How Do Inheritances Shape Wealth Inequality? Theory and Evidence from Sweden. Review of Economic Studies 90(1), 463–498. doi:10.1093/restud/rdac016
- Piketty, T. (2011). On the Long-Run Evolution of Inheritance: France 1820–2050. Quarterly Journal of Economics 126(3), 1071–1131. doi:10.1093/qje/qjr020
- Piketty, T. and Zucman, G. (2014). Capital is Back: Wealth-Income Ratios in Rich Countries 1700–2010. Quarterly Journal of Economics 129(3), 1255–1310, and online data appendix. doi:10.1093/qje/qju018
- Piketty, T., Saez, E. and Zucman, G. (2018). Distributional National Accounts: Methods and Estimates for the United States. Quarterly Journal of Economics 133(2), 553–609. doi:10.1093/qje/qjx043
- Saez, E. and Zucman, G. (2016). Wealth Inequality in the United States since 1913: Evidence from Capitalized Income Tax Data. Quarterly Journal of Economics 131(2), 519–578. doi:10.1093/qje/qjw004
- Smith, M., Zidar, O. and Zwick, E. (2023). Top Wealth in America: New Estimates under Heterogeneous Returns. Quarterly Journal of Economics 138(1), 515–573. doi:10.1093/qje/qjac033
Books, conference volumes and working papers
- Goldin, C. and Katz, L. F. (2008). The Race between Education and Technology. Cambridge, MA: Belknap Press of Harvard University Press.
- Jordà, Ò., Schularick, M. and Taylor, A. M. (2017). Macrofinancial History and the New Business Cycle Facts. In M. Eichenbaum and J. A. Parker (eds), NBER Macroeconomics Annual 2016, vol. 31, 213–263. Chicago: University of Chicago Press. doi:10.1086/690241
- Piketty, T. (2014). Capital in the Twenty-First Century. Cambridge, MA: Belknap Press of Harvard University Press.
- Piketty, T. (2020). Capital and Ideology. Cambridge, MA: Belknap Press of Harvard University Press.
- Rognlie, M. (2015). Deciphering the Fall and Rise in the Net Capital Share: Accumulation or Scarcity? Brookings Papers on Economic Activity, Spring 2015, 1–69.
- Stansbury, A. and Summers, L. H. (2017). Productivity and Pay: Is the Link Broken? NBER Working Paper 24165. nber.org/papers/w24165
Data
- US Bureau of Labor Statistics. Consumer Price Index for All Urban Consumers (CPI-U), US city average, all items (CUUR0000SA0); Nonfarm Business Sector: Labor Share for All Workers (PRS85006173), via FRED.
- World Inequality Database (2026). WID.world bulk data, 15 October 2026. https://wid.world